

Keeping eyes on GCP infrastructure resources is essential for your applications to work seamlessly. DevOps team should get notified when applications or services went down or inaccessible due to some issues like compute instance/s crossed defined threshold, K8S pods crashed, network went down at some region, etc. Getting alerts on configured notification channels allows DevOps teams to act quickly to rectify and resolve issues to keep your services up and running.
Here GCP monitoring and alerts are come to the rescue and terraform allow us to manage these resources as a code (IaC).
GCP Monitoring and Alerts
GCP monitoring provides a complete solution to collect and analyze the metrics of GCP resources and visualize them in the form of dashboards. GCP also allows you to monitor your applications’ availability using uptime checks. We can set up alerts when user defined criteria for resource state, utilization get matched and you will get notified on configured notification channels like email, slack, etc.
Why Terraform
We can create infrastructure manually using GCP console. If it’s a small infrastructure and for specific environment like Dev or Prod only, then its Ok to go with manual infrastructure creation.
Glossary -
Dashboards
Graphical visualizations of GCP resource metrics.
Alerts
Message raised by GCP monitoring when certain criteria get matched in resource metrics.
Notification Channel
Communication channels where GCP will send alert notifications like email, slack, etc.
Uptime Check
Checks application availability is application is responding for specific API/health check call.
Infrastructure as Code
Allow us to create and manage Gloud infrastructure/resources using code.
Diagram

Fig – Infrastructure creation using Terraform.
Configuring monitoring and alerts for few resources for single environment may not take too much time, but what if we need to configure it in multiple environments like dev, prod, staging, qa for multiple times, this will consume large amount of time and energy. Here terraform comes into picture to automate infrastructure creation, we can create, modify, and destroy resources quickly.
Terraform In Short
Terraform is an infrastructure as code (IaC) tool developed by HashiCorp, it allows us to manage and provision cloud infrastructure.
Terraform Code
Here, as we can see there is code snippets of terraform main, variable files, modules for notification channels, uptime checks and alerts for uptime checks. For creation alerts and monitoring we have created a simple python app using terraform startup script as seen below.
VM starup script
"sudo apt-get update; sudo apt-get install -yq build-essential python3-pip rsync; pip install flask; echo -e \"from flask import Flask \napp = Flask(__name__)\n@app.route('/')\ndef hello_cloud():\n\treturn 'Hello Cloud'\n\napp.run(host='0.0.0.0')\" > app.py; python3 app.py;"
Python “Hello Cloud” App. 
Monitoring Dashboard
module>monitoring>dashboard>dashboard.tf
resource "google_monitoring_dashboard" "dashboard" {dashboard_json = var.dash_json}environment>dev>main.tf
module "flask_app_dashboard" {source = "../../module/monitoring/dashboard"dash_json = jsonencode({"displayName": "Flask App VM Dashboard","dashboardFilters": [],"mosaicLayout": {"columns": 48,"tiles": [{"width": 24,"height": 16,"widget": {"title": "VM Instance - CPU utilization [MEAN]","xyChart": {"chartOptions": {"mode": "COLOR"},"dataSets": [{"breakdowns": [],"dimensions": [],"measures": [],"minAlignmentPeriod": "60s","plotType": "LINE","targetAxis": "Y1","timeSeriesQuery": {"timeSeriesFilter": {"aggregation": {"alignmentPeriod": "60s","perSeriesAligner": "ALIGN_MEAN"},"filter": "metric.type=\"compute.googleapis.com/instance/cpu/utilization\" resource.type=\"gce_instance\""}}}],"thresholds": [],"yAxis": {"label": "","scale": "LINEAR"}}}},{"xPos": 24,"width": 24,"height": 16,"widget": {"title": "Flask App logs panel","logsPanel": {"filter": "resource.type=\"gce_instance\" resource.labels.instance_id=\"${module.flask_app_vm.instance_id}\" resource.labels.zone=\"us-central1-c\"\n","resourceNames": ["projects/1055175960331"]}}}]},"labels": {}})}
terraform apply -target module.flask_app_dashboard.google_monitoring_dashboard.dashboard -var-file dev.tfvars
Generated Dashboard in GCP Console

Uptime Checks – TCP and HTTP
module>monitoring>uptime-check>http>http-uptime-check.tfresource "google_monitoring_uptime_check_config" "http-uptime-check" {for_each = local.flat_hostsdisplay_name = "${each.value.hostname}-http-uptime-check"timeout = "60s"selected_regions = ["ASIA_PACIFIC", "USA", "EUROPE"]http_check {path = each.value.pathport = each.value.portuse_ssl = each.value.use_sslvalidate_ssl = each.value.validate_sslaccepted_response_status_codes {status_class = "STATUS_CLASS_2XX"}accepted_response_status_codes {status_value = 301}accepted_response_status_codes {status_value = 302}}monitored_resource {type = "uptime_url"labels = {project_id = var.project_idhost = each.value.hostname}}}environment>dev>main.tf#TCP UPTIME CHECKmodule "flask_app_tcp_uptime_check" {source = "../../module/monitoring/uptime-check/tcp"tcp_uptime_hosts = var.flask_app_tcp_uptime_check_hostsproject_id = var.project_id}#HTTP UPTIME CHECKmodule "flask_app_http_uptime_check" {source = "../../module/monitoring/uptime-check/http"http_uptime_hosts = var.flask_app_http_uptime_check_hostsproject_id = var.project_id}
Environment variables
Here we can set uptime checks for multiple targets, just add multiple targets/hosts in Json array.
Generally, we don’t need tcp and http uptime checks for same application, here we have created it just for example.
environment>dev>dev.tfvars#TCP UPTIME CHECKflask_app_tcp_uptime_check_hosts = [{hostname = "35.209.69.34"port = "5000"}]#HTTP UPTIME CHECKflask_app_http_uptime_check_hosts = [{hostname = "35.209.69.34"path = "/"port = "5000"use_ssl = "false"validate_ssl = "false"}]
terraform apply -target module.flask_app_http_uptime_check.google_monitoring_uptime_check_config.http-uptime-check -var-file dev.tfvars
terraform apply -target module.flask_app_tcp_uptime_check.google_monitoring_uptime_check_config.tcp-uptime-check -var-file dev.tfvars
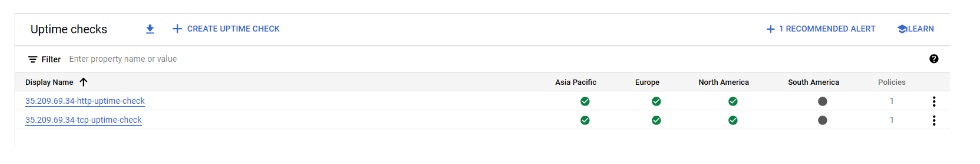
Created uptime checks in GCP console
Notification Channels
module>monitoring>notification-channel>email.tfresource "google_monitoring_notification_channel" "email" {display_name = var.email_channel_display_nametype = "email"labels = {email_address = var.notification_email}}environment>dev>main.tf#NOTIFICATION CHANNELmodule "notification_channel_email" {source = "../../module/monitoring/notification-channel"notification_email = var.notification_emailemail_channel_display_name = var.notification_email_desc}
environment>dev>dev.tfvars#NOTIFICATION CHANNELnotification_email = "alerts@yourdomain.com"notification_email_desc = "notification email for to receive uptime check alerts"
terraform apply -target module.notification_channel_email.google_monitoring_notification_channel.email -var-file dev.tfvars
Created Notification Channels in GCP console

Alerts for Uptime checks
module>monitoring>alerts>alert-policy-uptime-check.tfresource "google_monitoring_alert_policy" "alert-policy-uptime-check" {project = var.project_idenabled = truecount = length(var.uptime_check_ids)display_name = "Uptime check alert policy for ${element(split("/", var.uptime_check_ids[count.index]), 3)}"documentation {content = "Uptime check failed for ${element(split("/", var.uptime_check_ids[count.index]), 3)}"}notification_channels = [var.notification_channel]combiner = "OR"conditions {display_name = "Uptime check for ${element(split("/", var.uptime_check_ids[count.index]), 3)}"condition_threshold {filter = <<EOTmetric.type="monitoring.googleapis.com/uptime_check/check_passed" AND metric.label.check_id="${element(split("/", var.uptime_check_ids[count.index]), 3)}" AND resource.type="uptime_url"EOTduration = "0s"threshold_value = "1"comparison = "COMPARISON_GT"aggregations {alignment_period = "1200s"cross_series_reducer = "REDUCE_COUNT_FALSE"per_series_aligner = "ALIGN_NEXT_OLDER"group_by_fields = ["resource.label.project_id","resource.label.host"]}trigger {count = "1"}}}user_labels = {severity = "critical"}alert_strategy {auto_close = "604800s"}}
environment>dev>main.tf#ALERTS - TCPmodule "flask_app_tcp_email_alerts" {source = "../../module/monitoring/alerts"depends_on = [module.flask_app_tcp_uptime_check, module.notification_channel_email]uptime_check_ids = module.flask_app_tcp_uptime_check.tcp_uptime_check_idsnotification_channel = module.notification_channel_email.notification_channel_id}#ALERTS - HTTPmodule "flask_app_http_email_alerts" {source = "../../module/monitoring/alerts"depends_on = [module.flask_app_http_uptime_check, module.notification_channel_email]uptime_check_ids = module.flask_app_http_uptime_check.http_uptime_check_idsnotification_channel = module.notification_channel_email.notification_channel_id}Environment>dev>output.tfoutput "tcp_uptime_check_ids" {value = module.flask_app_tcp_uptime_check.tcp_uptime_check_ids}output "http_uptime_check_ids" {value = module.flask_app_http_uptime_check.http_uptime_check_ids}output "notification_channel_id" {value = module.notification_channel_email.notification_channel_id}
terraform apply -target module.flask_app_email_alerts.google_monitoring_alert_policy.alert-policy-uptime-check -var-file dev.tfvars
Created Policies in GCP Console.


Conclusion
Smooth running if apps and services in cloud environments is critical to corporate success. GCP monitoring provides robust solution for tracking resource metrics and application availability, it will help support team to act quickly if case of any abnormality. Terraform (IaC) allows DevOps teams to efficiently manage and automate infrastructure, alerts and monitoring across multiple environments in minimum time and effort.

 Accessibility


